March 14, 2011
More Frequent Earthquakes in our future
An article in the NY Times this morning concluded - "Perhaps the message is we should re-evaluate the occurrence of superlarge earthquakes on any fault," Dr. Stein said.
Dr. Stein isn't the only one thinking it might be wise to look at recent trends in large earthquakes.
So let's take a look at the data from the USGS database to determine how many large earthquakes have occurred each year over the last 40 years and how much energy was released by those earthquakes each year.
The numbers are eye-opening. Any engineer designing our buildings, roads, and power plants should be taking these latest earthquake trends into account.
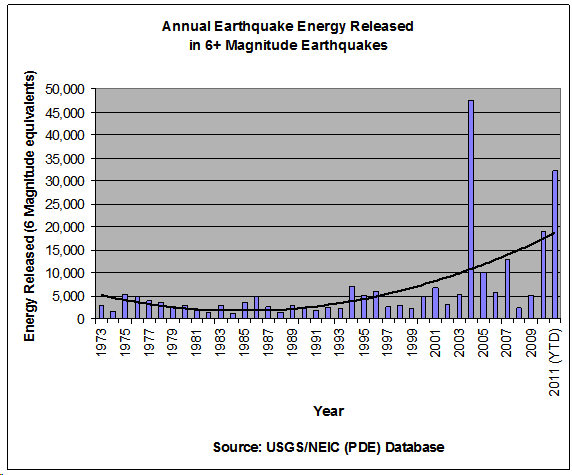
The data is clear - the number of large earthquakes per year (6 and greater) is up by a factor of 1.44x and the average energy released each year from those earthquakes is up by a factor of 3.07x when comparing the period from 1973 to 1989 vs. the period from 1990 to today. The USGS database records start in 1973, so that's as far back as we can go using that database.
Many folks have heard the rule of thumb that if an earthquake is 1 magnitude larger than a smaller earthquake, then it is 10 times larger than the smaller earthquake.
Most assume that means the larger earthquake releases 10x the energy of the smaller earthquake. In fact, the larger earthquake releases close to 32x the energy of the smaller earthquake. Log(Energy Released) = 1.5 * Magnitude
That means that an magnitude 8 earthquake releases 1,000 times the energy of a magnitude 6 earthquake.
The units used for the Y axis in the graph above are calculated based on the energy released from 1 magnitude 6 earthquake.
The data for each year is the sum of the energy released for all of the earthquakes that year where a magnitude 6 earthquake counts as a 1 and a magnitude 8 earthquake counts as 1,000. A magnitude 9.0 earthquake like we saw in Japan last week counts as 31,623 on that scale.
The USGS data for the last 7 days is here. It is astounding. Immediately following the large 9.0 magnitude earthquake, there were 14 aftershocks of 6+ magnitude every 10 or 15 minutes for the next 3 hours.
Updated 3/16/2011: USGS has now upgraded the earthquake size from 8.9 to 9.0. The article statistics and the graph have been updated to reflect that change.
Labels:
Earthquake
Subscribe to:
Post Comments (Atom)

3 comments:
What complete fabricated rubbish! Why not take that graph back to 1900? Like the one at the bottom of this page.
http://www.johnstonsarchive.net/other/quake1.html
Fraud!
This data is hardly fabricated. The source of the data presented comes directly from the USGS. The graph presents all the data for 6 magnitude earthquakes and greater that is available in the USGS/NEIC (PDE) database. As I stated in the original post, this database starts in 1973.
Feel free to verify those facts at http://earthquake.usgs.gov/earthquakes/eqarchives/epic/epic_global.php
I also considered using the NGDC database of significant earthquakes, but I saw that the number of earthquakes recorded in that database was quite sparse compared to the data recorded in the NGDC database.
The graph you provide confirms the data I have presented. We have had a significant increase in earthquake energy released since 2004 compared to the relatively quiet period from 1960 to 2003.
John - fraud? Mark's graph looks like a zoom-in on the graph you reference. Both show a recent increase since the 70s, and the graph you reference doesn't have 2011 yet... they look remarkably consistent to me.
Post a Comment